Are there "dirty" hours when the California electric grid is producing a lot of CO2 per kWh, and "clean" hours with low CO2 output? It seems that midday should have lower CO2/kWh compared to other hours, if a large fraction of power across the state is generated by solar photovoltaics (PV) during these hours. Looking at data, Beyond Efficiency did in fact find a midday reduction in CO2 emissions per kWh generated for 2014 onward.
First, Beyond Efficiency (BE) created an hourly time series of California electricity produced by generator type for the years 2012-2016 using California Independent System Operator (CAISO) data; download the BE timeseries and analysis in Excel format here. Next, BE applied a greenhouse gas (GHG) emissions factor to each generator type to estimate the total GHG emissions from the CAISO grid for each hour of the day—a dirtiness factor—in terms of pounds CO2 equivalent per kWh of electricity generated. Average emissions factors for each generator type were taken from Wikipedia.
On the CAISO grid, the midday period from about 10am to 3pm is becoming increasingly clean, with GHG emissions per unit of electricity averaging 30-65% lower than emissions during the 6-9pm generation peak. Adding more solar generation to the grid in years to come will magnify this pattern. California's Renewable Portfolio Standard (RPS) mandates that utilities generate 50% of electricity from renewable sources by 2030.
Each month has a different emission profile, but starting in 2014 we begin to see a dip in emissions for most months during the midday:
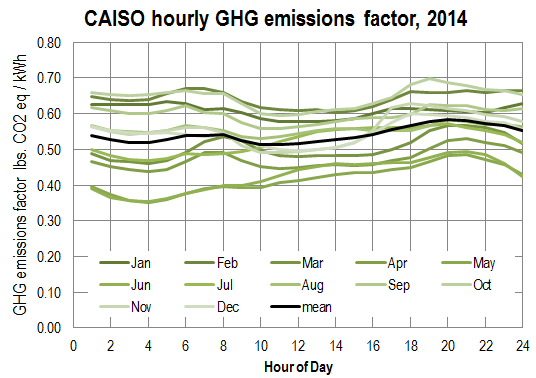
Chart 1
Chart 1 also shows almost 30% difference in GHG emissions per kWh of electricity between winter and early summer (Feb and May). The black line through the center of Chart 1 shows an average value for all months together. Even on average, we still see the dip beginning at sunrise and continuing through midday.
How has this average day evolved since 2014? An enormous amount of solar photovoltaic panels have been added by utilities to the CAISO electric grid. The chart below shows the same annual analysis for 2016. Not only is the midday dip more pronounced, but the average emissions for every month have fallen.
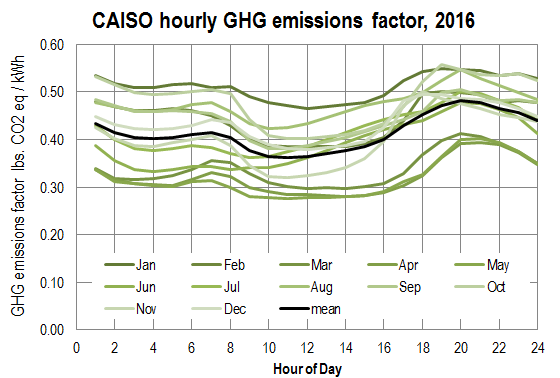
Chart 2
Now let's put it all together. The following chart shows "average day" emission profiles for 2012-2016. The midday drop in dirtiness becomes a clearer and more pronounced pattern in later years, reflecting increased solar PV deployment on the CAISO grid.
This is just the beginning of solar photovoltaic (PV) deployment on the grid. To estimate the hourly "dirtiness factors" for a future scenario "Year 20XX," we assume doubling of solar generation capacity, but no increase in overall generation. We doubled the 2016 solar generation data for every hour, and curtailed Thermal and Import generators each by half the difference during that hour, to keep total generation levels at every hour equal to those in 2016.
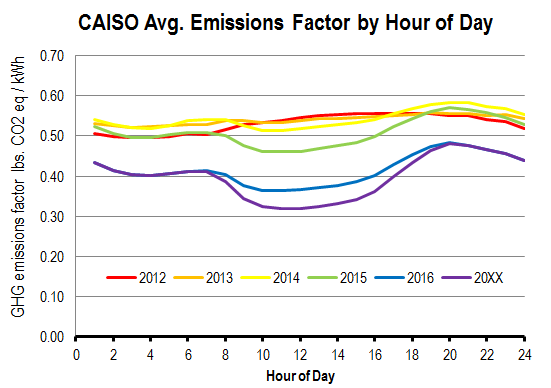
Chart 3
Can we reduce the GHG emissions from an electrical load by 30% just by rescheduling the load from 8pm to midday? There is an argument that the "marginal" emissions should be used for this kind of decision-making instead of the average existing emissions. That is, a dirty plant must be brought online to add the marginal power to accommodate my decision to turn on an incremental electric device. But I'd argue that each user is getting the average electron, not the marginal electron, and although the marginal plant will make the average CO2/kWh dirtier because of my decision to run a load, the electron I'm getting would be only slightly dirtier than the pre-existing average.
In other words, if everyone shifted their loads from 8pm to midday, then midday would get dirtier because the fossil fuel powerplants would need to run at midday to cover the increased load. However, it seems we could have virtually unlimited renewable electrical capacity at midday by deploying more solar PV, so long as the loads occur simultaneous with this PV generation, and the loads are flexible enough to take whatever they can get from the sun, without creating new loads for fossil fuel generators on cloudy winter days. Make hay while the sun shines.
Energy consuming products that make use of midday solar when it is available, without disrupting the grid or creating storage burden, would appear to be the way forward. Energy storage has financial and environmental costs that work against its usefulness.
What time of day is "peak demand"? There is some leftover thinking that midday/3pm is "peak demand" with highest costs and we should load-shift until after dark with low demand and low electricity rates. This is true in many states that don't have as much solar PV deployed. It's funny that solar PV in California has nearly made the opposite true! It appears that midday is the period with the cleanest electricity, lowest demand, cheapest and most reliable power source, and (forthcoming) lowest utility rates. (See CAISO's publication "Matching Time-Of-Use Rate Periods with Grid Conditions Maximizes Use of Renewable Resources").
Can the hourly GHG emissions be incorporated into energy simulation software for buildings? Around 2008-9 the firm E3 was hired by the California Energy Commission to produce this set of estimated hourly GHG/kWh for the power grid from 2012-2020, for use in building energy modeling. It was briefly incorporated into Energy Pro but became outdated and was not incorporated into the following CBECC-RES code compliance software. The original E3 series may still exist in the outputs of non-compliance analysis in Energy Pro.
The E3 data series didn't anticipate the massive deployment of utility-scale solar PV that would occur 2013-2016. Perhaps E3 thought that the utilities would meet their RPS obligations with a diversity of renewables that didn't spike at midday. One author states: "The assumed renewables were 20% by 2020 when that tool was developed; in reality, California already hit about 27% renewables in 2016 and is on pace to exceed 33% by 2020. Furthermore, CA has seen lower electricity demand, and greater rooftop PV penetration than was estimated back in 2009 when we did the analysis." Chart 4 below shows how E3's estimated GHG/kWh has some variation but it's basically flat across the 24-hr day, and it doesn't reflect the strong pattern of midday cleanliness shown in the post-2014 CAISO data.
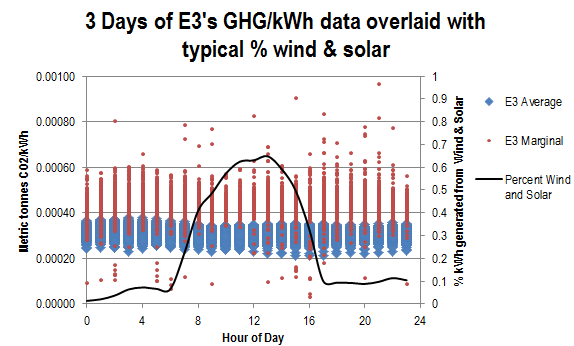
Chart 4
To estimate the GHG pollution of building design alternatives, we encourage building energy modelers to manually multiply their hourly kWh consumption by the emissions factors estimated here. If you give it a try and have results, please share them!
Notes on data sources
The original CAISO daily generation summaries each have a unique URL. Here is an example, and other can be obtained by changing the date in the filename: http://content.caiso.com/green/renewrpt/20160221_DailyRenewablesWatch.txt
These were converted by BE by applying a workflow for compiling CAISO data to Excel time series; just contact us for instructions if you're interested in doing this yourself.
Nicholas Thompson created a previous hourly timeseries from CAISO and was the inspiration for this work. Euan Mearns provided analysis and commentary on Nicholas's data in this post at Energy Matters.
List of power stations in California: https://en.m.wikipedia.org/wiki/List_of_power_stations_in_California


